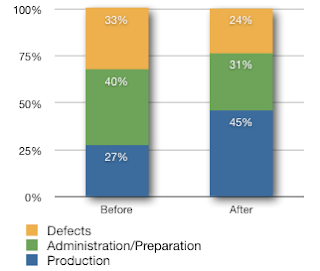
The Graph That Got Away
 I have been thinking a lot about how to present information about agile and TOC improvement efforts lately. Last night I had a look at some old process data, and had the opportunity to reflect upon a route I didn't take at the time I was involved in the improvement project. The project was switching from traditional RUP-based development to Scrum (with a healthy dose of TOC).
At the time I collected the data, from an andon (Kanban board) I had helped a development team set up, the top priority was finding and exploiting bottlenecks in the process. The second priority was reducing inventory (Design-In-Process). Therefore I focused on Throughput and DIP.
That was the right decision under the circumstances, and it did work. The manager I worked for had experience with Lean, and had no problem understanding what the development team and I was doing. That particular manager did not need my assistance in explaining what was happening to other managers, but what if he had? Is there something besides productivity data I could have provided to support him?
Yes, there is. Tracking what happened in the project on the andon did not just yield productivity data, it also showed how people spent their time. Most managers are pretty
The left bar in the graph above shows how people spent their time at the beginning of the change project, while there was still a lot of holdover from the previous, RUP-based, development method.
The right bar shows how people spent their time about four months later. As you can see, there is more time spent on producing stuff, and less time spent on fixing defects and administrative tasks and planning. I haven't a graph for it, but during this time, quality went way up, and communications with other stakeholders improved. The reason is that the priorities were clear. The team knew what to do at all times, and so they could communicate and plan more efficiently.
 If one is enamored by tales of hyperproductivity in agile development teams, the difference between the two bars may not seem all that much to write about, but look at the graph to the left. It shows the difference in how time was spent.
An increase in effective production time by 69% is pretty good. This does not translate directly to a 69% increase in productivity (or revenue) but it shows there is increased potential. Before the project everyone but the manager who hired me would have laughed at the idea that there was room for a 69% improvement.
Data like this does indeed strengthen the case for going agile, or TOC.
Of course, as a TOC practitioner, I am well aware that agile (usually but not always) focuses on measures targeted to improve productivity and code quality, and that the bottleneck is often elsewhere. (It often is external to the development team.) However, easy to understand data about one part of the organization like the graphs above, can be useful to gain support for a TOC analysis and an improvement program that focuses on the true bottleneck.
Improving the wrong thing is a common reason for failure in improvement programs. Suppose there is an improvement program, agile, TQM, Six Sigma, Lean, whatever, that shows results similar to the one above, and there is no corresponding improvement in the company's revenue stream. It is a pretty safe bet development team productivity wasn't the organization's bottleneck.
On the other hand, you can prove an improvement in how time was spent after instituting a process improvement program. Now you are in a position to point out that the only thing needed to improve the organization as a whole, is to make a similar improvement at the current bottleneck.
Of course, with TOC you are in a pretty good position to find the bottleneck, regardless of whether it is a physical constraint, or a policy constraint.


Comments