Thursday, March 15, 2007

Fixes That Fail

Many companies use a standard response in troubled times, they appoint a new CEO. The new CEO takes measures. If the CEO is a former sales person, he focuses on improving sales. If the CEO is a former accountant, there will be a savings program. A CEO with a technical background will focus on developing new products. The outcome is usually one of the following:
  1. The company takes a nosedive, crashes and burns.
  2. Nothing happens. The gradual decline continues. Eventually
    yet another CEO is appointed.
  3. There is improvement. Sometimes the improvement is radical.
    after awhile, the rate of improvement abates. Then the
    company begins to backslide. Eventually another CEO
    is appointed.
  4. There is a sustained improvement in the company's financial
    health. This is rare though.
The third alternative, initial success followed by backsliding, is in many ways the most interesting outcome. First of all it is a common outcome. Second, it often seems inexplicable. The CEO proved his management genius with the initial success. Why can't the improvement be sustained? Third, the explanation model for this alternative can teach a lot about the other alternatives too.

Though the particulars may vary, the underlying causes are usually the same. Figure 1 shows what happens in a common case. A new CEO is appointed. In this example, the CEO is an experienced manager, with a strong background in sales.


Figure 1: How Success Begets Failure.

The Capacity Constrained Resource (CCR) of most companies (, about 70%, according to Gerald I. Kendall in Viable Vision: Transforming Total Sales Into Net Profits,) is in sales. to improve sales, you do not necessarily have to be a good corporate manager. All you need to be is a good sales person.

If the CEO is a former sales person, he will know what to do as long as sales is the CCR. Most likely, he will do much of the grunt work himself. This is why so many managers, CEOs or not, are so busy with sales. Sales may be the CCR, but the real reason the manager spends so much time and energy on it, is that it is the one thing he knows how to do.

Of course, if the manager has some other background, he is just as likely to continue with activities in his area of expertise. For example, bosses who are former programmers often continue to make software design decisions, or write code. (The difference is that because the initial CCR is most likely to be in sales, it is less likely that a CEO with some other background hits the CCR with his "improvement" measures. Therefore, the decline phase is likely to set in immediately.)

As long as sales really is the CCR, there will be improvement. The manager is considered brilliant, a winner. Unfortunately, if sales improves enough, a new area in the company will become the CCR. Even worse, because the CEO spent so much of his personal energy on improving sales, the rest of the company is in decline, speeding the emergence of a new CCR.

When the new CCR emerges, the CEO lacks the management knowledge to identify and correct the problem. Thus, the initial success is followed by decline.


Figure 2: Going Down.

Most managers are extroverts, and have a great deal of confidence. This i not bad per sé, but it may contribute to trapping a CEO in the reinforcing loop shown in Figure 2. Well grounded confidence in an area of expertise, may easily turn into overconfidence in another. Most CEOs I have met are not given to introspection, and this makes it hard for them to discover when their own actions are becoming part of the problem. This is especially true if those same actions have led to success before.

With a sound foundation in management theory, a problem like this can be dealt with, or avoided entirely.

A CEO who knows a little bit of Systems Thinking, will recognize the problem above as a specific case of the Fixes That Fail systems archetype, and counter the problem using the recommended Systems Thinking tactics. (Which I'll leave it to you to discover if you are interested. Google a bit, or buy and read The fifth Discipline by Peter M. senge.)

Lean managers do not fall into the trap as easily, because a Value Stream Map will tell them where the problem areas in the value stream are. Once diagnosed, Lean offers plenty of simple, reliable tools to deal with almost any process problem.

Theory Of Constraints managers use buffer monitoring to find the problem areas, and the Focusing Steps to deal with them wherever they emerge.

Statistical Process Control (SPC) can alert managers to emerging problems before they become too serious to deal with, but does not offer generic solution techniques.

Early on I stated that the explanation model above offers some hints about what happens in the other common cases:

Alternative 1: Crash and burn is most likely to happen when the situation is really bad from the beginning, and management measures are totally inappropriate. Why a CEO would do something wildly off base, is explained in Figure 1.

Alternative 2: Whatever the CEO does, does not affect the CCR. The decline continues, and the CCR is fired before a new CCR emerges. (If a new CCR does emerge, there may be a sudden acceleration in the rate of decline.)

Alternative 4: The CEO is able to use generic management principles to deal with problems as they emerge. This is the steadiness of purpose and consistent drive to improve seen in successful Lean companies like Toyota.

Friday, March 02, 2007

Truth, Damned Truth, and Statistics, Part 2

This is part 2 in a series of articles. You can read the first part if you click here.

In the previous article in this series, I discussed how to measure and visualize the Throughput part of the Return On Investment (ROI) equation. This time I'll focus on Inventory (I).

As you may recall, Inventory is defined as "money tied up in the system". Inventory includes all the equipment you use in a development project, computers, software, chairs, tables, etc. In a manufacturing process, Inventory would also include the partially finished material being worked on in the process itself, the Work-In-Progress, or WIP.

In a software development process there is no WIP, but there is an analog: partially finished software. This includes requirements, design specifications, and any code that is not fully finished, tested, and ready for release. Partially finished software is sometimes called Design-In-Progress, or DIP. The DIP has a monetary value. The value of the DIP is the amount of money lost producing DIP that is never used because of requirements changes, plus the cost of removing partially finished software from the system. This cost can be quite high.

The less DIP there is, the less risk we take that requirements changes will cause the project to waste effort.

We cannot have zero DIP, because then the project team would have nothing to work on, but it is obvious we want to keep the DIP as low as possible.

There are two basic approaches to entering material into a production process: push systems, and pull systems. As it turns out, these two models have vastly different effects on the DIP.

A push model, as used in RUP and other traditional software development methodologies, means that each step in the production chain pushes material to the next step: a project leader assigns work to team members, analysts work as fast as possible to push work to designers, designers push to programmers, programmers push to testers.

Push systems designed to be cost cost efficient, that is, they are an attempt to maximize the number of work items per hour, per person. Unfortunately, the production capacity of different parts of a production process is never balanced. Some parts will have higher capacity than others. In addition, the capacity varies. As a result, queues with DIP will build up in the process. Perhaps the testers can't keep up, or the DBA can't keep up with the programmers, or the analyst finished a truck load of requirements before the designers even got started.

In a pull system, each step in the production chain signals the step before when it is ready to take on more material. Work is pulled into the system no faster than it can be handled. This keeps the DIP to a minimum. The most well know pull system technique is called Kanban. It is the technique used by Extreme Programming. (Though the name "Kanban" is used very rarely.) There is a slightly different pull system model called Drum-Buffer-Rope, which is used by Feature Driven Development. All agile methodologies use pull systems. It is part of what makes them agile. (It is also one of the most misunderstood parts of agile.)

Figure 1: Design-In-Progress in Agile and Traditional Projects.

Figure 1 shows how DIP builds up in two projects. The agile project, using a pull model, never processes more than five stories concurrently. From this it is possible to surmise that the team either consists of five solo developers, or ten developers working in pairs. The process runs smoothly, with the DIP winding down to zero at the end of each iteration.

The non-agile project is different. DIP is allowed to build unchecked, and gets much higher than the DIP in the agile project. Thus, the non-agile project risks to loose more money if requirements change. we can also see that in iteration two and three, DIP builds until late in the project, and then suddenly drops. There is a big batch of material building up, and getting released at the end of the project. This indicates that there is a process step at the end that can't keep up with the steps before it. This is likely to be the testers, working frantically to test what the developers produce.

If the testers are overloaded with work, and the project still makes the iteration goals every time, it is most likely that the testers have been pressured into skipping tests. This in turn may indicate that the testers are using a brute force "test everything" approach. This is bad, because it may indicate that the quality of the code the team produces is low. It is much better if the developers use defect prevention techniques (unit testing, pair programming, refactoring, etc.) to keep the code quality acceptable. Of course, it may also indicate that the testers just do not know how to test statistically significant samples. Either way, it is up to the management to step in and fix the process.

Note that the DIP does not quite reach zero at the end of an iteration. There is a backlog of unfinished work building up. This is a project destined for large delays. Traditional methodologies, like RUP, may cause enormous amounts of DIP to build, but they have no mechanism for monitoring it! This is why project delays often come as a surprise to management very late in a project. (That, and the fact that Management By Fear causes many project managers to actively hide information about problems in a project.)

How To Measure DIP

As you can see, monitoring the DIP can tell you a lot about the state of a project. Measuring the DIP is easy. In the project I am currently working in, we use an andon board, i.e. a whiteboard where we have a table with a column for each step in the development process. At the start of an iteration the team writes a sticky note for each story. At the beginning of an iteration, all stories are in the leftmost column, the backlog column. When someone begins to work on a story (s)he moves the corresponding sticky note to the next column. Eventually, each story has travelled to the Done! column.

To measure the DIP, all I have to do is to keep track of how when stories are moved from one column to the next. I use a spreadsheet to do this. Then I use a small Ruby program to a DIP graph (and several other graphs).

Thursday, March 01, 2007

Five Things Managers (Usually) Don't Get About Agile

Clash 1: Goals
Traditional development methods set three goals:
  • Keep within budget
  • Implement all requirements (often specified before the project starts)
  • Make the deadline
Agile projects set the following goal:
  • Maximize the Return On Investment (ROI)
To maximize the ROI, an agile project changes the following variables:
  • Cost
  • Scope
  • Time
In other words, what traditional software development, and most companies, set as fixed goals, are just the things an agile project need to change to reach its goal.

Clash 2: Push vs. Pull
Another major difference is that most companies, and traditional development methods, are based on push systems, while agile is based on pull systems. :
  • In a push system, each step in a production line does what the previous step tells it to do.
  • In a pull system, each step in a production line does what the following step has to do.
The situation when orders start travelling from both ends of the command chain can at best be described as chaotic.

Clash 3: Cost Efficiency vs. Lead Time Reduction
A third difference is that traditional methodologies, and traditionally managed companies, seek to raise the cost efficiency, while agile methodologies seek to reduce lead times. There is a connection between the two:
  • When cost efficiency goes up, lead times will also go up
  • When lead times are reduced, cost efficiency goes down
It should be IOTTMCO that if corporate management seeks to push cost efficiency up, while a project team seeks to push lead times down, there will be a clash.

Clash 4: Responsibilities
A fourth difference is that agile is based on systems thinking, and views most problems as systemic, and therefore the responsibility of the system owners, which is of course the management. Traditional management, on the other hand, views most problems as special cause problems, and leave it to their work force to do firefighting.

Clash 5: Attitude to Knowledge and Training

Scientific Management based, management seeks to make people easily replaceable by reducing the amount of training each person needs to do his or her job. (This shows very clearly in the RUP philosophy of dividing work into very narrowly defined roles.) In original Scientific Management, the idea was that profound knowledge of how processes work should reside with management. Today, the SM philosophy has lead to management reducing their own knowledge about how systems work to practically nothing.

In contrast, agile emphasizes very broad training, so that each individual can fit as many jobs as possible. Management is expected to have very deep knowledge of systems thinking, Lean, TOC, and of course of agile philosophy and practices.

www.henrikmartensson.org is Down, but Kallokain is Up

As you may have noticed www.henrikmartensson.org has been down for some time. The site went down because some of the software broke when the host system was upgraded. Before putting the system up again, I will fix some broken links and other problems.

My schedule is rather full these days, mostly with the joys of fatherhood, but also with a major writing project, and a few other things, so getting the site going again will take some time.
I will spend time blogging again though. The past few months have been incredibly hectic, but the past few weeks my life has settled down to a somewhat saner pace. Besides, my writing addiction is stronger than ever.

Truth, Damned Truth, and Statistics

Statistics may not be what floats your boat, but statistics can tell some important things about software development projects.

In this article, I'll show how even a very simple analysis of some basic project measurements can be exceedingly useful. The data in the following analysis is fake, but the situations they describe are from real projects.

A commercial software development project is a system that turns requirements into money. Therefore it makes sense to use economic measures, at least for a birds eye view of a project. If you have read my earlier postings, you will be familiar with the basic equation describing the state of a business system, the Return On Investment (ROI) equation:

ROI = (T - OE) / I

T = Throughput, the rate at which the project generates money. Because it is hard to put a monetary value on each unit of client valued functionality, this is commonly measured in Story Points, Function Points, or Feature Descriptions instead. I'll use Story Points, because it is the unit I am most comfortable with.

OE = Operating Expenses, the money expended by the project as it produces T. This includes all non-variable costs, including wages.

I = Inventory, money tied up in the system. This is the value of unfinished work, and assets that cannot be easily liquidated, like computers and software. Also called "Investment".

In this installment, I'll focus on Throughput, and a close relative, the Defect Rate. In a following article, I will discuss measuring Investment and Operating Expenses.

Throughput Diagram with Confidence Interval

Let's begin by looking at Throughput. The total Throughput of a project is the value added by the project. That is, if you get €300,000 for the project, then T = €300,000. A project is not an all or nothing deal. For example, the €300,000 project may have six partial deliveries. That would make each delivery worth €50,000. Normally, each partial delivery comprises several units of client valued functionality. A unit of client valued functionality is, for example, a use case. Thus, a use case represents monetary value.

Use cases do not make good units to measure Throughput, because they vary in size. Measuring Throughput in use cases would be like measuring ones fortune in bills, without caring about the denomination. However, a Story Point (SP), defined, for the purposes of this article, as the amount of functionality that can be implemented during one ideal working hour, has a consistent size. That is, a 40 SP use case is, on average, worth twice as much as a 20 SP use case. (This is of course a very rough approximation, but it is good enough for most development projects.)

We can estimate the size of use cases (or stories, if you prefer the XP term), in SP. Once we have done that, it is possible to measure Throughput. Just total the SPs of the use cases the team finishes in one iteration. The word "finished" means "tested and ready to deploy in a live application". No cheating!


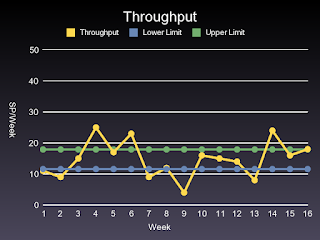
Figure 1: Throughput Per Week

Figure 1 shows the Throughput per week for a project over a 12 week period. As you can see, the productivity varies a lot. The diagram has two lines indicating the upper and lower control limits of the Throughput. Within the limits, or within the confidence interval, as it is also called, the project is in statistical control.

The control limits in this case are +- 3 standard deviations from the mean Throughput. What this means is that if the Throughput stays within the confidence interval each week, we have a stable production process, and we can, with 95% certainty, say that the future productivity will be within the limits set by the confidence interval.

If the Throughput is outside the control limits, as it is in Figure 1, the development process is out of control. This means that it is not possible to make predictions about the productivity of a week in the future based on past productivity. It also means it is useless for management to ask the developers how much work they can finish the next week.


Figure 2: Throughput Per Month

A project that is unpredictable in a short perspective, may well be predictable if you take a longer perspective. Figure 2 shows Throughput data for the same project, over the same time period as Figure 1. The difference is that the Throughput data has been aggregated into monthly figures. As you can see, the productivity for each month is pretty even, and well within the statistical control limits. The development team can, with 95% certainty, promise to deliver at least 47 SP each month. They can also promise an average production rate of 59 SP per month.

Given the Throughput, and the total number of SP for the project, it is possible to predict how long a project will take with fairly good accuracy. Obviously, such measurements must be continuously updated, because circumstances change. Requirements are added, or removed, the team may loose or add members, the code complexity tends to increase over time. All these factors, and many more, affect the Throughput over time, and may also cause a project to change from a controlled to an uncontrolled state.

Note that just because a project is in a controlled state, it does not mean the project is going well. A project that consistently has 0 Throughput is in a controlled state. Having the project in a controlled state does mean that we can make predictions about the future.

Having a project in a controlled state also means that if a project has problems, the causes are most likely to be systemic. That is, the problems arise from poor organization, a poor process, or outdated policy constraints, too little training, the wrong training, etc. Statistical Process Control (SPC) people call systemic causes "common causes".

Common cause problems must be fixed by the process owners, i.e. the management. The developers can't do much about it because the problem is out of their control.

When something happens that puts a project outside the predicted confidence interval, the cause is a random event. SPC people call random events "special causes". Special causes have to be dealt with on a case by case basis.

In practice, special causes are fairly rare. In the book Out Of the Crisis (1982), Edward Deming states that about 6% of all problems in production processes are due to special causes. The vast majority, 94%, of all problems have systemic causes. Much of the problems we experience in software projects are due to confusing special causes with common causes, i.e. causes of systemic failure.

A couple of years ago I worked in a project plagued with problems. Out of all the problems besetting the development team every day, only one problem was a special cause problem: we lost an afternoons work because we had to vacate the building. There was a fire in an adjacent building belonging to another company. The fire was a special cause of delay because it occurred only once. Had fires been a recurring problem, it would have been a common cause problem, and management would have had the responsibility to deal with it. (Three solutions off the top of my head: Get the other company evicted. Teach the other company safety procedures so there are no more fires. Move to other, safer, premises.)

Let's focus on common causes. They are the most interesting, because the vast majority of problems fall in this category. The problem with common causes are that management usually fails to identify them for what they are. the failure to identify common causes is of course itself a systemic failure, and has a common cause. (I leave it to you to figure out what it is. It should not be too hard.) The result is that management resorts to firefighting techniques, which leaves the root cause unaffected. Thus, it won't be long until the problem crops up again.

The first thing to do with a problem is to notice that it is there. The second thing to do is to put it in the right category. A diagram with a confidence interval can help you do both.

Once you know the problem is there, you can track it down using some form of root cause analysis, for example Five Why, or a Current Reality Tree (from the TOC Thinking Tools). My advice is to start with Five Why, because it is a very simple method, and then switch to the TOC Thinking Tools if the problem proves hard to identify, you suspect many causes, or if it is not immediately obvious how to deal with the problem.

Defect Diagram With Confidence Interval

The Throughput diagram does not give a complete picture of how productive a project is. It is quite common for a development team to produce new functionality very quickly, but with poor quality. This means a lot of the development effort can be spent on rework. I won't go into the economic details in this article, but fixing defects may account for a substantial part of the cost of a project. In addition, defects cause customers to be dissatisfied, which can cause even greater losses. A high defect rate is also an indicator of a high level of complexity in the code. This complexity reduces Throughput, and in most cases it is not necessary. (I haven't seen a commercial mid to large software development project yet that did not spend a lot of effort dealing with complexity that did not have to be there in the first place.)


Figure 3: Defect Graph

Figure 3 shows a defect graph. These are defects caught by a test team doing inspection type testing, or by customers doing acceptance testing, or using the code. It is important to note that the graph shows when defects were created, not when they were detected. This is important to know, because if you do not know when defects where created, you won't know if process improvements you make have any effect on the defect rate. If you measure when defects are detected, as most projects do, there may be years until you see any effects from an improved process.

In this case, the defect rate is within the control limits all the time, which means the defects that do occur are a systemic problem. The control limits are rather far apart, indicating a process with a lot of variation in results. Reducing the defect rate is clearly a management problem.

The Limitations of Calculating the Confidence Interval

The confidence interval method has several limitations. First of all, you need a process that varies within limits. If you measure something that has a continuous increasing or declining trend, confidence intervals won't be very useful.

Second, the method can detect only large shifts, on the order of 1.5 standard deviations or more. For example, in Figure 3, the number of defects seem to be declining, but all data points are within the confidence interval. It is impossible to say whether the number of defects are really going down, or if there are just two lucky months in a row. Thus, if some method of defect prevention was instigated at the beginning of month 2, it is not possible to tell if these measures had any real effect. A more sophisticated statistical method, like Exponentially Weighted Moving Average (EWMA), could probably have determined this.

Third, it is assumed that the data points are relatively independent of each other. This is likely to be the case in a well run project, but in a badly organized project, the Throughput may be influenced by a wave phenomenon caused by excessive Inventory. (I'll discuss that in the next article in this series.) When such conditions exist, the confidence interval looses its meaning. On the up side, excessive Inventory shows up very clearly in a Design In Process graph, so management can still get on top of the problem.

Calculating a confidence interval for a chart is still useful in many cases. It is a simple method. Any statistical package worth its salt has support for it. (I used the Statarray Ruby package, and drew the graphs with Gruff. You can find it on RubyForge.)