Friday, March 28, 2008

IO Map for Process Design


I had reason to think about how to design processes recently, and just for fun I drew the Intermediate Objective map you see above. This is a process level IO map. It shows the necessary conditions that must be fulfilled in order to have a good process design.

The map is meant to be generic, so you may have to adapt it to fit a special situation. In most cases, it can be used as is. Note though, that one of the necessary conditions for creating a good process is understanding how the goal of the process furthers the goal of the organization using the process. In other words, you need an IO map for the organization (or equivalent) in order to create a good process.

I won't write a long-winded article with a detailed explanation of the map, at least not for now. However, if you have any questions, don't hesitate to ask.

Wednesday, March 12, 2008

Change Or Die

Larry Leach pointed to an interesting article about behavior change in individuals and organizations in the CriticalChain group at Yahoo.

According to the article, medical research shows nine people out of ten would rather die than change their behavior. In other words, scaring people into eating less junk food, quit smoking and drinking, and exercising more has only a 10% success rate.

On the other hand, with positive reinforcement, 77% will change.

Minds On Fire

You might wish to read this article, by John Seely Brown and Richard Adler, on how we learn. It has sparked a lot of discussion in the blogosphere.

Here is a quote:

Compelling evidence for the importance of social interaction to learning comes from the landmark study by Richard J. Light, of the Harvard Graduate School of Education, of students’ college/university experience. Light discovered that one of the strongest determinants of students’ success in higher education—more important than the details of their instructors’ teaching styles—was their ability to form or participate in small study groups. Students who studied in groups, even only once a week, were more engaged in their studies, were better prepared for class, and learned significantly more than students who worked on their own.6

The emphasis on social learning stands in sharp contrast to the traditional Cartesian view of knowledge and learning—a view that has largely dominated the way education has been structured for over one hundred years. The Cartesian perspective assumes that knowledge is a kind of substance and that pedagogy concerns the best way to transfer this substance from teachers to students. By contrast, instead of starting from the Cartesian premise of “I think, therefore I am,” and from the assumption that knowledge is something that is transferred to the student via various pedagogical strategies, the social view of learning says, “We participate, therefore we are.”

Sweden has used a strictly Cartesian system since 1864. I used to think the system was fairly good, but the more I have learned about learning, the more I have become aware of the flaws.

Choice - Peace On Streets


Clarke Ching blogged about the video above. You can also find it on Youtube.

I am really glad I live in a country where this is less of a problem than it is in many other places in the world.

Tuesday, March 11, 2008

Business Value

Managers like to talk about business value. It usually goes like this:
A group of managers sit around a table. It may be in a conference room, around a dinner table, or in a bar. "We must offer more business value," one of them says. Everyone nods in agreement. Then it grows silent. Uncomfortable. Everyone carefully avoids looking directly at anyone else. Finally, someone breaks the silence: "Anything interesting on TV tonight?"
Agile software developers caught on to the notion of delivering business value several years ago. As a result, software developers now have the same sort of dead end conversations about business value their managers have, with the same result.

I have played this little game myself upon occasion, both as part owner of a consultancy, and as a developer. It always played out the same way.

I was reminded about this today when I read an InfoQ article about business value. The article quoted extensively from an article by Joe Little, Toward A General Theory of Business Value. Both articles raise the question "what is business value?" Luke Hohmann has also blogged about business value, and InfoQ has an article about measuring success from the customer's point of view.

I'll focus on answering questions raised in the first two articles mentioned. Both articles are invitations to much needed discussion. Little does list a set of requirements for a business value based engineering approach, but before examining that, lets begin with a basic definition of the term business value.

Wikipedia has the following definition:
In management, business value is an informal term that includes all forms of value that determine the health and well-being of the firm in the long-run.
The first thing to note is that business value depends on context. The term business value means different things for different companies.

What is less obvious, but extremely important, is that because different parts of the same organization have different goals, business value means different things to different people in the same organization.

Thus, a group of managers that sit down and try to agree on a simple, yet specific definition are doomed to fail. Software developers have a slightly different problem: they usually don't know what their own organizations goals are, and even less about their customers goals. Under those circumstances, they too are doomed to fail.

Still, if you look at it from a systems thinking, or Theory Of Constraints, point-of-view, there isn't much of a problem at all. For a systems thinker it is obvious where to begin:
Before we can know what adds value to a system, we must know the goal of the system.
The goal of a company is usually to make as much money as possible now and in the future.

What brings us closer to the goal? The top level is easy. We need a healthy cash flow, and we need to optimize the Return On Investment (ROI).

Return On Investment is a composite value:

ROI = (Throughput - Operating Expense) / Investment

The question becomes what do we need to ensure a healthy cash flow, optimal Throughput, and optimized Inventory and Operating Expenses?

We can express this using an Intermediate Objective map, like this:
An Intermediate Objective map is unique. It is possible for two organizations to have identical maps, but it is extremely unlikely. Therefore, replacing the question marks with specifics, requires working with each organization.

I published my own organization's IO map awhile ago. Have a look at it if you want a full-blown example.

Once you understand the goal of an organization, or, using TOC terminology, the Goal, Critical Success Factors (CSF), and Necessary Conditions (NC), you have a basis for defining business value for an organization. Something has positive business value if it helps you achieve an NC, CSF, or the Goal. Usually, the something affects an NC, so the effect on the CSFs and the Goal is indirect.

Note how important it is to delve down a bit. If you stop to high, for example at the ROI component level, you get a definition that is technically correct, but practically useless. Delve too low, and you will get bogged down in too much detail. (TOC has other tools for that.)

You should be aware of two things: first, there is more to constructing an IO map than I have shown here. IO maps are part of a system, The Logical Thinking Process (TLTP), and you need to know the system very well to make a good IO map. Second, there are alternative methods, for example Strategy Maps and Strategy & Tactics Trees.

Now we are ready to tackle a the problem of creating a Business Value based engineering approach. I am going to walk through each point in Joe Little's list:
  • a well-communicated high-level definition of business value (this might have multiple dimensions)
An Intermediate Objective map does that very well. Actually, the map shown above constitutes a good high level definition.
  • a well-communicated operational definition of BV for the specific effort
That would be a process level IO map.
  • a clear way to measure whether that hypothesis (as embodied in the operational definition) was correct; or how incorrect it was (probably a likelier outcome)
That would be a measurement system based on the IO map. I am working on a webcast about this, so I won't delve into it here.
  • a confirmation that this definition actually energized behavior (eg, the programmers wanted to see success in that way) and that it was used in a way that allowed small adjustments toward a better outcome
You get such confirmation by measuring an whether an action regarding an entity low in the IO map has an effect on an entity higher up.

Then again, your tastes may run to behavioral analysis techniques. I'd suggest using the IMPACT model, and of course ABC analysis. (See Unlock Behavior, Unleash Profits by Leslie Braksick.)
  • a clear set of practices for using this definition throughout the course of the project
That is what the measurement system provides, incitement to move towards the NCs in the IO map.
  • a clear way to modify those practices, so that better practices could emerge over time
Since we are using TOC's IO maps, why not also use TOC's Focusing Steps for continuous improvement? I feel another webcast coming on.
  • a common understanding about the time-boxes around the practices, and a continual questioning about whether those time-boxes (presumably at different frequencies, depending on the practice) were the most effective in guiding a better delivery of business value in this specific case
Now we are talking! Full TLTP analysis! OODA loop based Strategic Navigation! Many agile teams already use an andon (from Lean). Maybe it's time to throw in a bunch of other Lean techniques, and data analysis tools from Six Sigma.
  • a set-out way to develop the people to perform these engineering practices (training and the like)
Ah, hrrm, got me there. Training in all the techniques I have mentioned above is available, but as far as I know, there is no training program that brings it all together.

One of the problems is that for such a training program to work, you will probably have to train software engineers and their managers together. Otherwise it will be hard to get them to pull in the same direction.
The agile community already has everything it needs to define business value for every agile software development project in the world. The tools are available. The information needed can usually be obtained through a TLTP analysis (or similar).

Of course, the same goes for the entire business community. After all, we are talking about the same tools, tools for examining systems, and reasoning about systems, tools that can be used by managers and engineers alike.

TOC and Systems Thinking tools aren't unknown in the agile community. David Anderson wrote a book about TOC in software development, Tom and Mary Poppendieck have written two excellent books about adapting Lean techniques for agile software development, Kent Beck mentions TOC in his eXtreme Programming 2.0 book.

Systemic approaches to specifying requirements, like Goal Directed Design, have been around for a long time. Alistair Cockburn uses a systemic approach for specifying requirements in the Crystal family of agile methodologies. (I almost wrote analysis, but specifying requirements well requires synthesis, understanding the whole, before analysis, understanding the parts.)

The agile community seems to be facing the same problem managers have been facing for more than forty years. All the tools, and all the knowledge they need is there, right before them, but as a whole, the community does not get it. Individuals, and small groups do, no question about it. The community as a whole, probably not.

The lethargy of the business community as a whole is a problem for the community, but for you and your company, whether you are a manager or a foot soldier, it is an opportunity. Learn how to define and deliver maximum business value, and you have a competitive advantage that will last for decades. Learn what it means to get inside the OODA loop of your competition.

Thursday, March 06, 2008

The Graph That Got Away

I have been thinking a lot about how to present information about agile and TOC improvement efforts lately. Last night I had a look at some old process data, and had the opportunity to reflect upon a route I didn't take at the time I was involved in the improvement project. The project was switching from traditional RUP-based development to Scrum (with a healthy dose of TOC).

At the time I collected the data, from an andon (Kanban board) I had helped a development team set up, the top priority was finding and exploiting bottlenecks in the process. The second priority was reducing inventory (Design-In-Process). Therefore I focused on Throughput and DIP.

That was the right decision under the circumstances, and it did work. The manager I worked for had experience with Lean, and had no problem understanding what the development team and I was doing. That particular manager did not need my assistance in explaining what was happening to other managers, but what if he had? Is there something besides productivity data I could have provided to support him?

Yes, there is. Tracking what happened in the project on the andon did not just yield productivity data, it also showed how people spent their time. Most managers are pretty obsessed with keen on spending time well. (Yes I know, Throughput and Inventory, not time, is what really counts, but time based arguments are what most people are used to, so a time based argument is what I'll use here.)

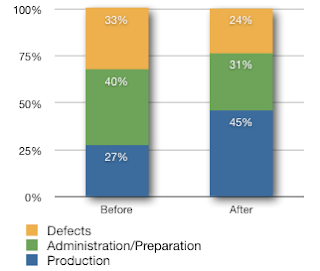
The left bar in the graph above shows how people spent their time at the beginning of the change project, while there was still a lot of holdover from the previous, RUP-based, development method.

The right bar shows how people spent their time about four months later. As you can see, there is more time spent on producing stuff, and less time spent on fixing defects and administrative tasks and planning. I haven't a graph for it, but during this time, quality went way up, and communications with other stakeholders improved. The reason is that the priorities were clear. The team knew what to do at all times, and so they could communicate and plan more efficiently.

If one is enamored by tales of hyperproductivity in agile development teams, the difference between the two bars may not seem all that much to write about, but look at the graph to the left. It shows the difference in how time was spent.

An increase in effective production time by 69% is pretty good. This does not translate directly to a 69% increase in productivity (or revenue) but it shows there is increased potential. Before the project everyone but the manager who hired me would have laughed at the idea that there was room for a 69% improvement.

Data like this does indeed strengthen the case for going agile, or TOC.

Of course, as a TOC practitioner, I am well aware that agile (usually but not always) focuses on measures targeted to improve productivity and code quality, and that the bottleneck is often elsewhere. (It often is external to the development team.) However, easy to understand data about one part of the organization like the graphs above, can be useful to gain support for a TOC analysis and an improvement program that focuses on the true bottleneck.

Improving the wrong thing is a common reason for failure in improvement programs. Suppose there is an improvement program, agile, TQM, Six Sigma, Lean, whatever, that shows results similar to the one above, and there is no corresponding improvement in the company's revenue stream. It is a pretty safe bet development team productivity wasn't the organization's bottleneck.

On the other hand, you can prove an improvement in how time was spent after instituting a process improvement program. Now you are in a position to point out that the only thing needed to improve the organization as a whole, is to make a similar improvement at the current bottleneck.

Of course, with TOC you are in a pretty good position to find the bottleneck, regardless of whether it is a physical constraint, or a policy constraint.